Research
My research develops statistical methods for complex, structured data, including functional data, matrices, and tensors, motivated by questions in neuroimaging and precision medicine.
Bayesian methods for neuroimaging data
Brain networks and connectivity matrices
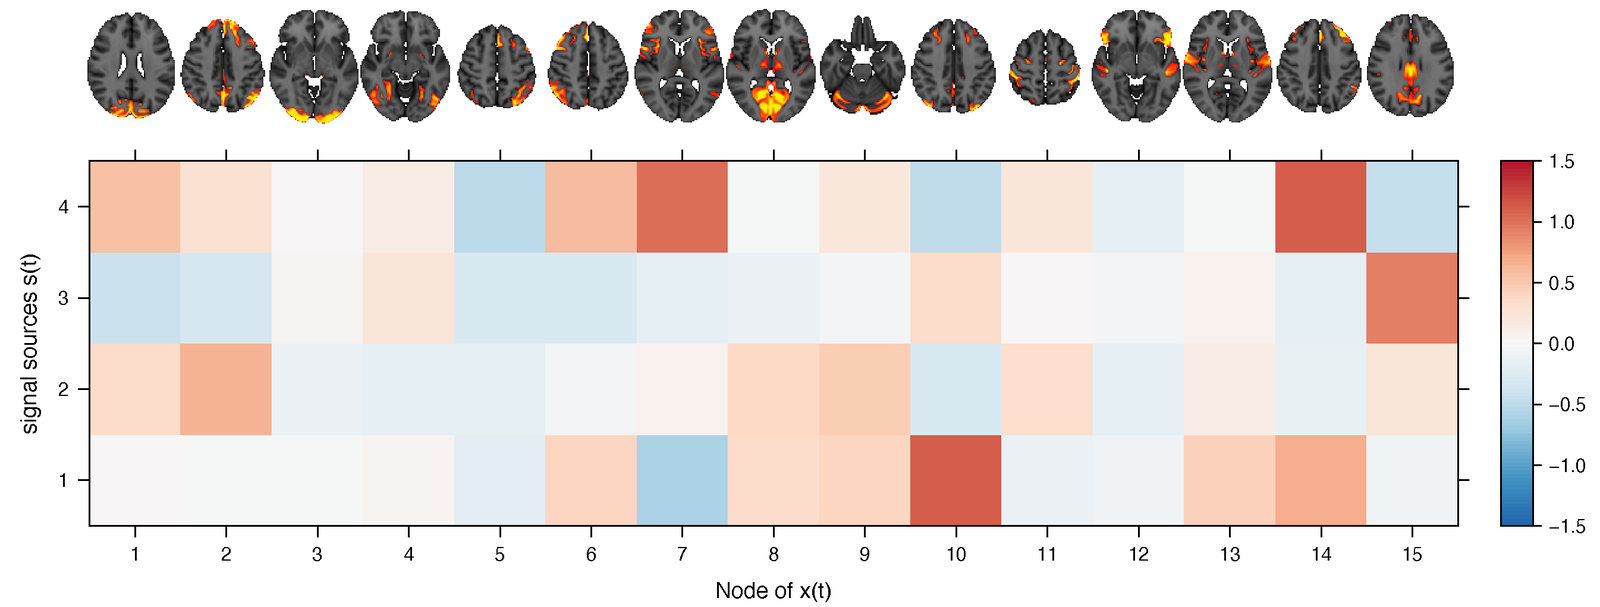
Functional connectivity describes how activity in different brain regions co-varies, giving each subject a symmetric positive-definite matrix. I develop regression models that use these matrices as predictors of cognitive or clinical outcomes while respecting their geometry, and that identify the sub-networks of brain regions driving the association. A related line of work clusters subjects by their connectivity or covariance matrices.
Functional and time–frequency data
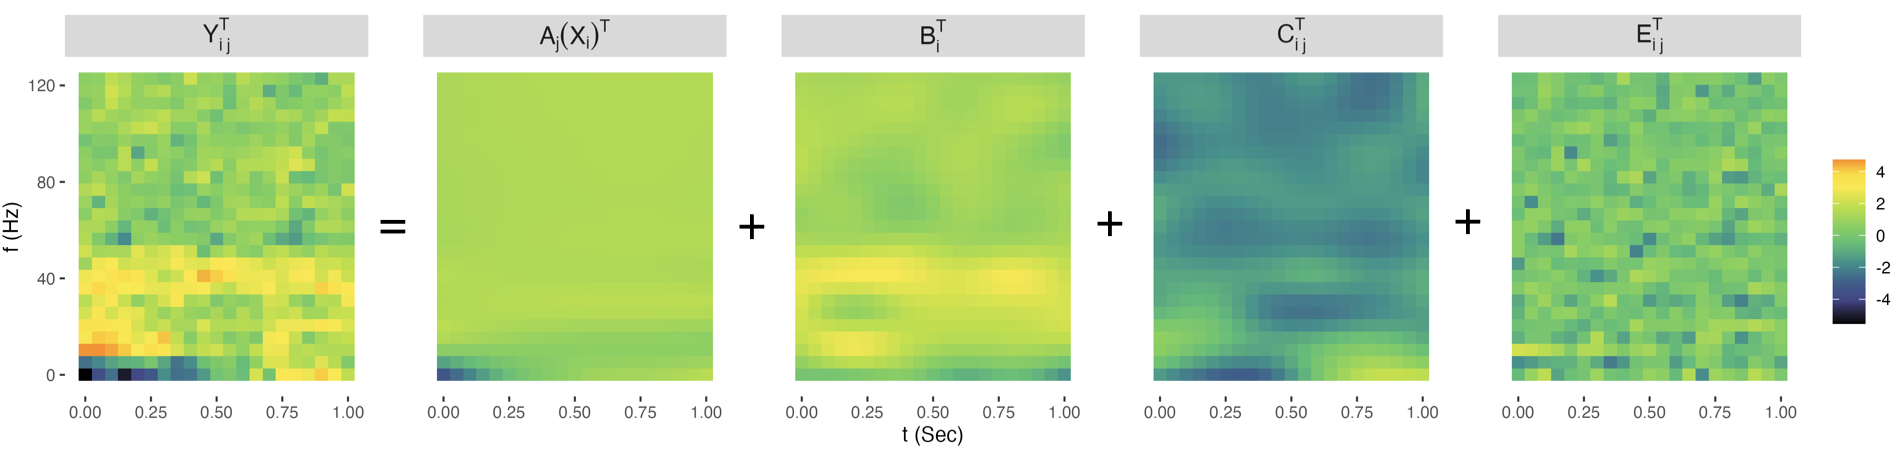
EEG experiments record brain activity as surfaces over time and frequency, measured for each subject under several experimental conditions. I develop Bayesian mixed-effects models for such multilevel two-way functional data, which separate population-level effects of conditions and covariates from subject- and trial-level variation.
Multi-way tensor data
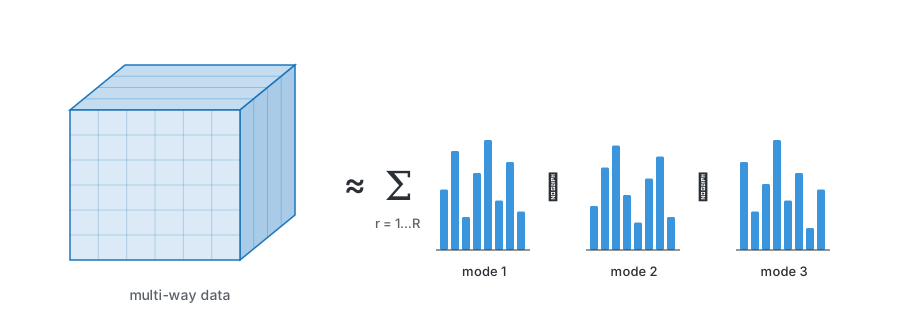
Many neuroimaging studies produce data indexed along several dimensions at once, which are naturally represented as multi-way arrays, or tensors. I am developing probabilistic models that summarize such data through a small number of interpretable components, with full uncertainty quantification.
Boosting for complex data
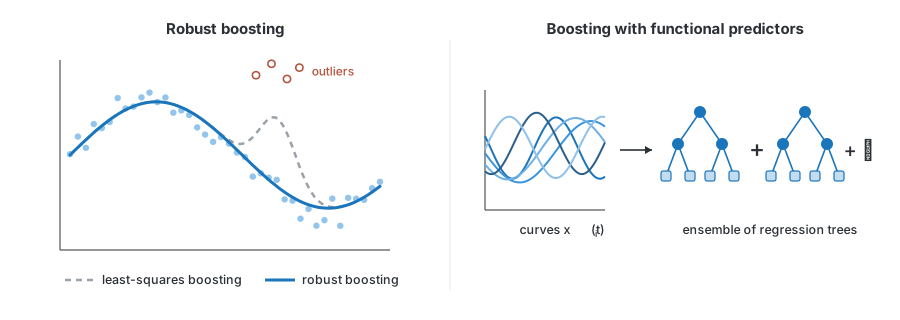
Gradient boosting builds flexible prediction models by combining many simple learners, such as small regression trees, one step at a time. My work develops boosting algorithms that are robust to outliers and that handle functional predictors, with implementations in open-source R packages.
Software
| Package | Description |
|---|---|
| BMEF | Bayesian mixed-effects models for multilevel two-way functional data (R) |
| RRBoost | Robust gradient boosting algorithms (R) |
| RTFBoost | Tree-based boosting for functional regression and robust variations (R) |